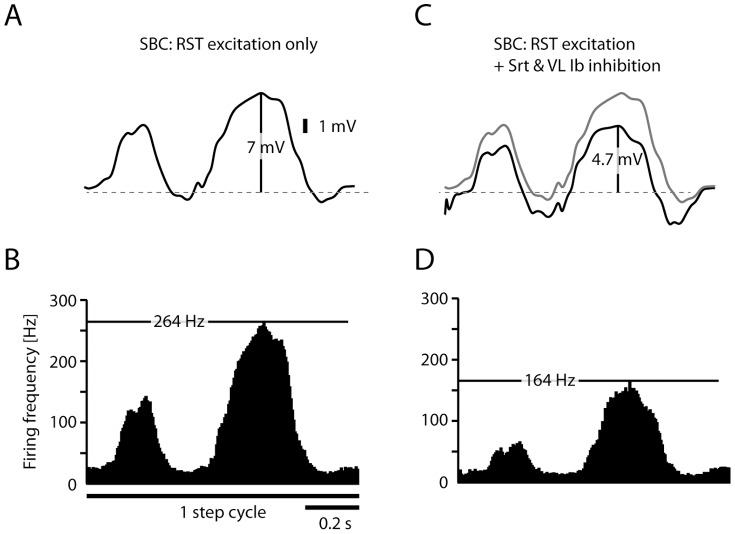
Figure 6. Simulated activity of SBCs receiving RST input and Ib inhibitory input.
(A) Simulated intracellular SBC signal of RST excitation only during one step cycle. The amplitude of the intracellular signal in the model (7 mV) corresponds to that recorded in VSCT neurons under fictive locomotion in paralyzed cats (7.1 mV) [9]. (B) Corresponding simulated spike responses in SBCs, summarized in histograms with the instantaneous firing rate (5 ms bin width) for the full step cycle. The maximum firing rate of the model is indicated by the horizontal black line (264 Hz). (C) Same simulation as in (A), but in this case including inhibitory synaptic inputs from the Srt and VL Ib inhibitory interneuron input (black line, compare with the response without inhibition, illustrated by the grey line). (D) Spike responses for the SBC neuron with summation of RST excitation with the Ib afferent evoked inhibition.

