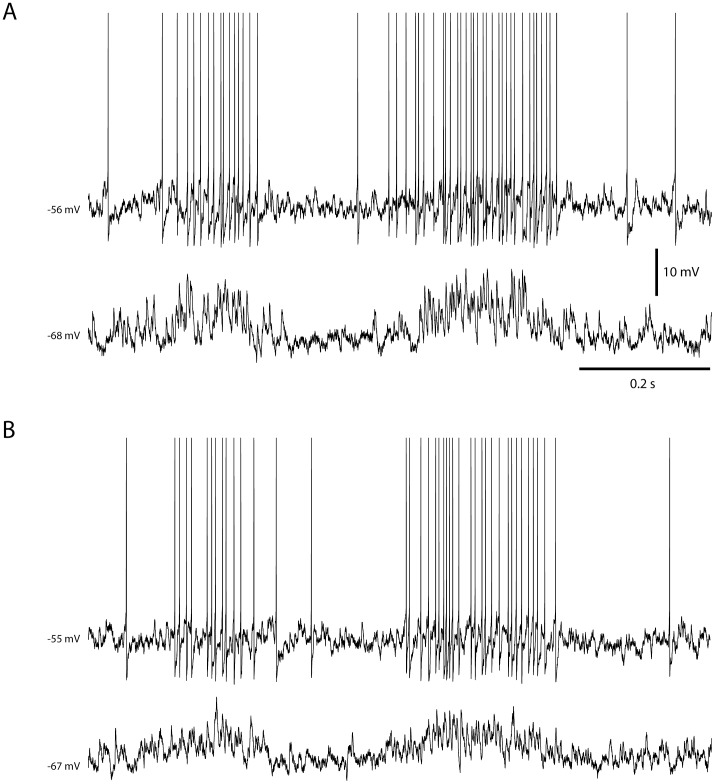
Figure 7. Examples of simulated granule cell responses during one step cycle.
Panels (A) and (B) represent simulations for granule cell 1 and granule cell 2, respectively (see Fig. 3). In both panels, the top trace illustrates the response of the simulated granule cell simulated with a normal membrane potential. The lower trace illustrates the responses of the stimulated granule cell with −20 pA bias current, preventing the cell from generating spikes.

