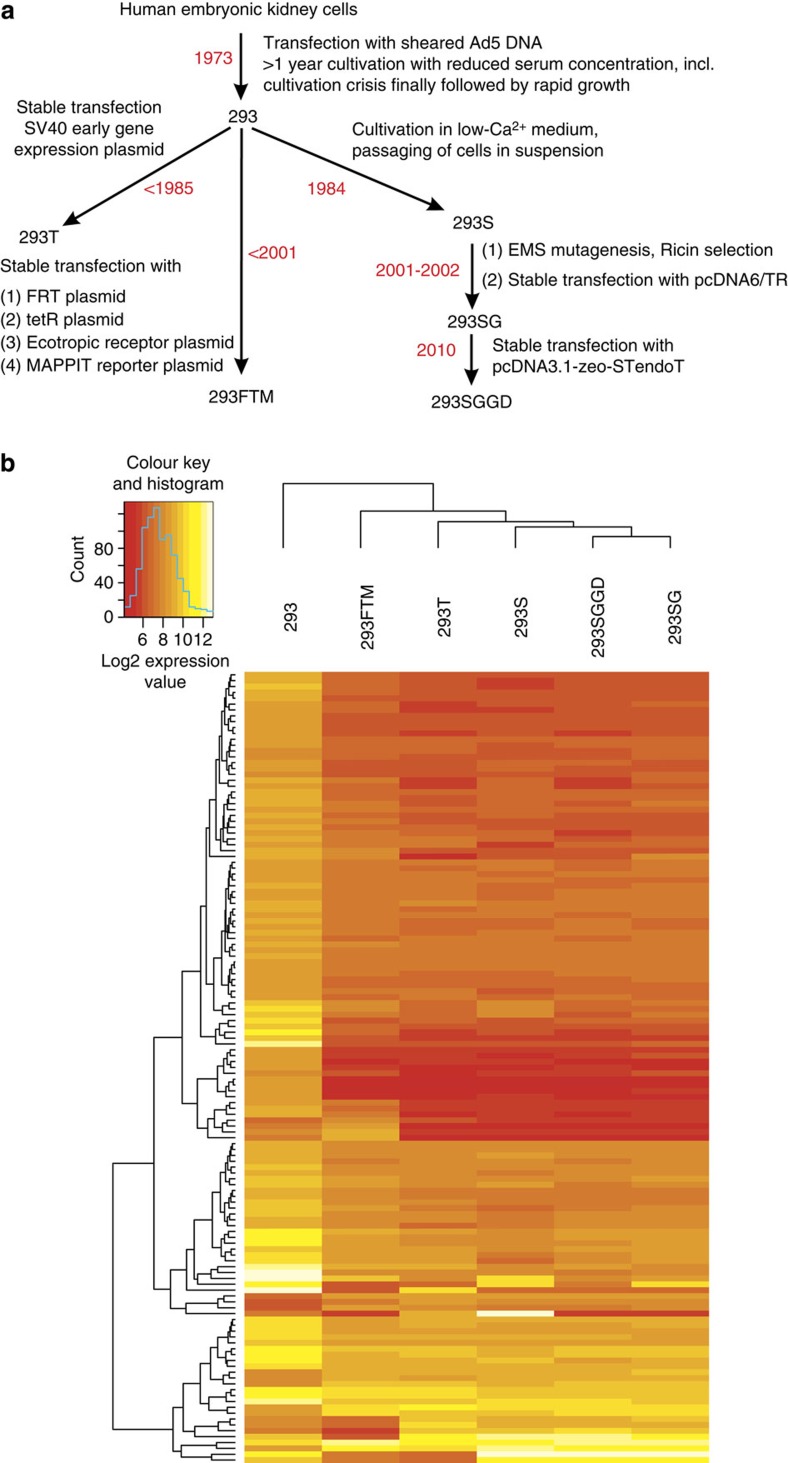
Figure 1. HEK293 cell line expression profiling.
(a) Schematic overview of the studied 293 cell lines and their derivation history. FRT plasmid: pFRT/lacZeo; TetR plasmid: pcDNA6/TR; ecotropic receptor plasmid: pM5neo-mEcoR; MAPPIT reporter plasmid: pXP2d2-rPAP1-luci. (b) Heatmap of the 136 genes differentially expressed in every cell line when compared with the 293 line. Colour-coded values represent the log2 expression values after summarization, normalization and averaging over three biological replicates per cell line. Genes (rows) and cell lines (columns) were clustered hierarchically according to similarity between expression levels. See also Supplementary Figs 6–8.

