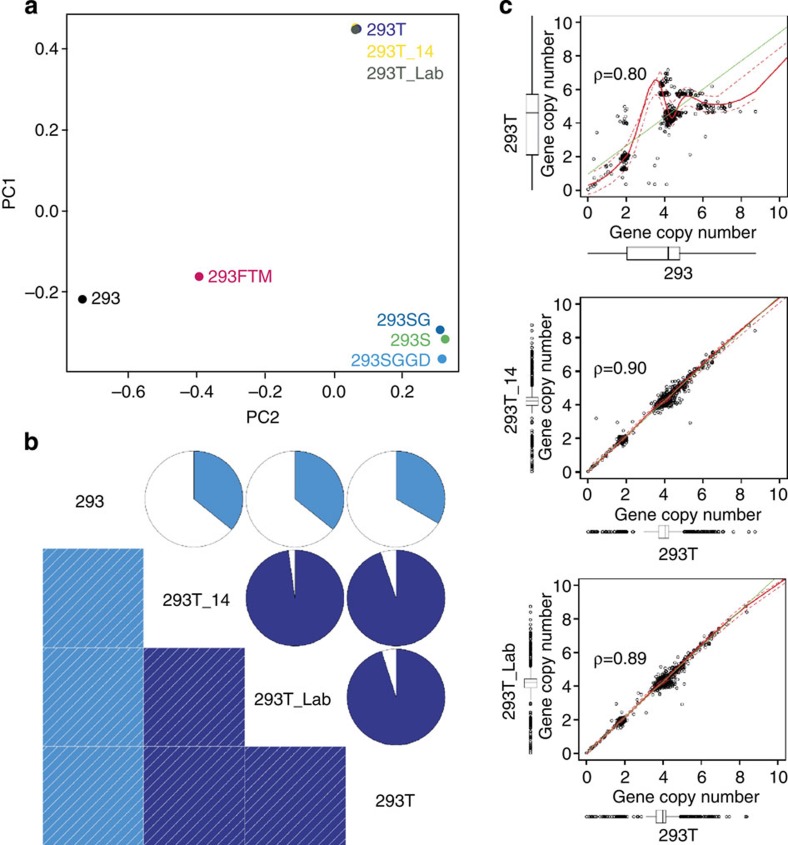
Figure 4. Effect of freezing and passaging on 293T genome stability on SNP content, whole-genome CNV and gene copy number.
(a) PCA (principle component analysis)-correlated SNP clustering reveals a strong correlation between the different 293T sequencing samples. Notably, this analysis also substantiates the common origin of the S lineage cell lines. (b) Comparison of the genome-wide 2-kb CNV content of the 293T samples among each other and with the 293 line again confirms the high consistency between 293T samples. The darker the shade of blue in the chart, the higher the correlation. (c) Comparison of gene copy number between the various 293T samples and 293. While the copy number of genes in the 293 line considerably deviates from the 293T gene copy numbers, the pattern of gene copy number of the newly sequenced 293T samples is very similar to the sequenced line of lower passage number.

