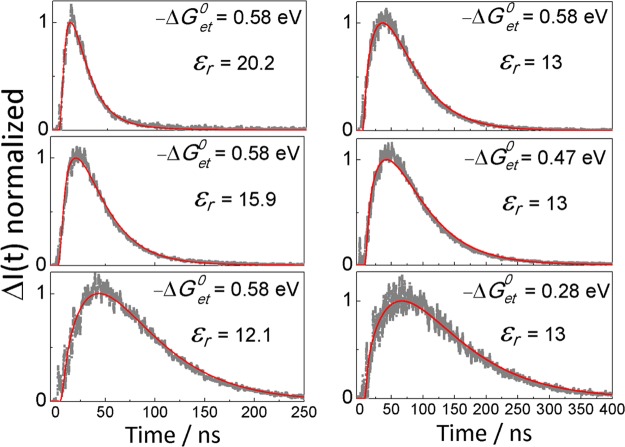
Figure 4.
Experimental (gray scatter plots) and calculated (red solid lines) time-dependent MFEs. The left column shows data for the anthracene/N,N-diethylaniline system at different εr in PA/BN mixtures. The right column illustrates the driving force dependence of the TR-MFEs observed for the systems 9,10-dimethylanthracene/N,N-dimethylaniline (−ΔGoet ≈ 0.28 eV), 9-methylanthracene/N,N-diethylaniline (−ΔGoet ≈ 0.47 eV), and anthracene/N,N-diethylaniline (−ΔGoet ≈ 0.58 eV) at εr = 13.

