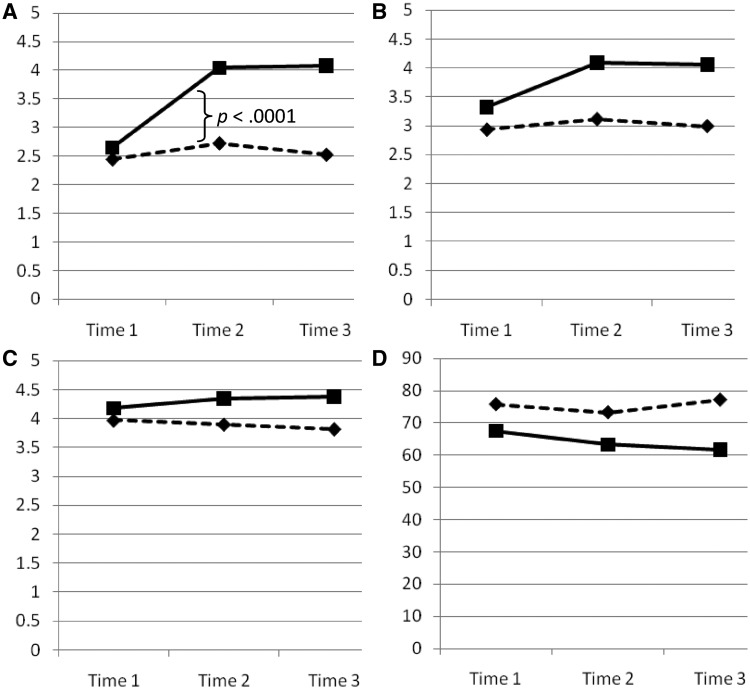
Figure 2.
Graphs with plotted means representing longitudinal trajectories for (A) parent’s knowledge, (B) parent’s efficacy, (C) pro-learning parenting behaviors, and (D) parent stress for the PIP (solid squares) and wait list groups (dashed diamonds). See Table IV for p-values and data. Note: Time 1 = baseline, Time 2 = posttreatment, and Time 3 = 3 months after intervention. Lower scores represent better functioning for parent stress measure only.

