
Figure 1.
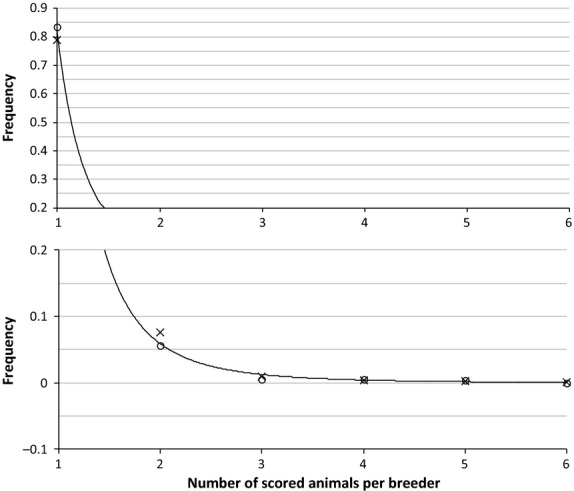
Frequency of the number of scored males (circles) and females (crosses) per breeder in the data set. Fitted curve (thin line) corresponds to equation y = 0.84x−3.92, fitted by regression.
Official websites use .gov
A
.gov website belongs to an official
government organization in the United States.
Secure .gov websites use HTTPS
A lock (
) or https:// means you've safely
connected to the .gov website. Share sensitive
information only on official, secure websites.
Frequency of the number of scored males (circles) and females (crosses) per breeder in the data set. Fitted curve (thin line) corresponds to equation y = 0.84x−3.92, fitted by regression.