
Figure 3.
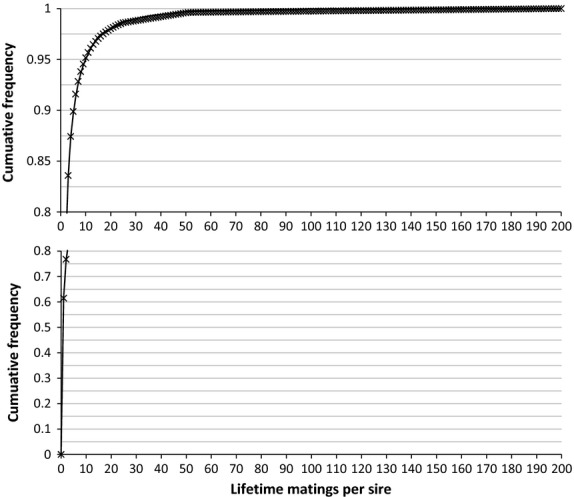
Cumulative density function observed (crosses) and expected (thin line) for the number of matings per male lifetime in the data set. Expected probability distribution was fitted by regression to y = 0.63x−2.01 up to a value of 25 matings, whereas for 26–50 matings, probability was equal to 4 × 10⁻³, and for 51–200 matings, probability was equal to 2.3 × 10⁻⁵.