
Figure 4.
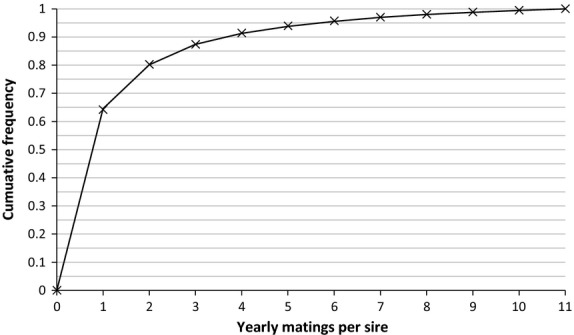
Cumulative density function observed (crosses) and expected (thin line) for the number of matings per male and year in the data set. Expected probability distribution was fitted by regression to y = 0.63x−1.98 up to a value of 11 matings. Expected values were adjusted to reach a maximum cumulative proportion of 1.