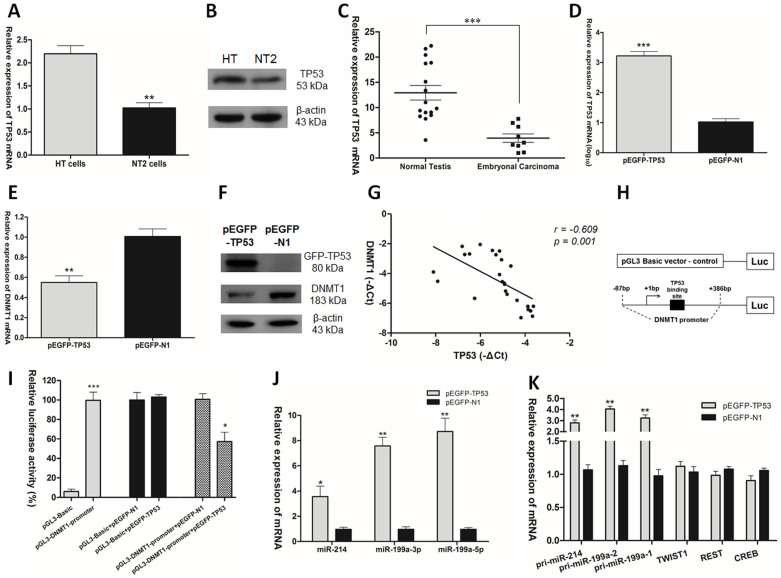
Figure 3. TP53 repressed the expression of DNMT1 and increased the expression of miR-199a/miR-214 in TGCT.
(A) TP53 mRNA expression and (B) TP53 protein level in HT and NT2 cells. (C) TP53 mRNA expression in normal testis tissues and embryonal carcinoma. (D) TP53 mRNA expression, (E) DNMT1 mRNA expression and (F) GFP-TP53 and DNMT1 protein levels after transfection of pEGFP-TP53 vector or pEGFP-N1 control vector into NT2. (G) Statistical analysis to evaluate correlation between TP53 and DNMT1 mRNA expression levels in clinical samples (r = −0.609, p = 0.001. Pearson's correlation). (H) Construct of pGL3-DNMT1 promoter luciferase reporter vector. (I) The vectors pGL3-Basic, pGL3-DNMT1 promoter, pGL3-Basic and pEGFP-TP53, pGL3-Basic and pEGFP-N1, pGL3-DNMT1 promoter and pEGFP-TP53, pGL3-DNMT1 promoter and pEGFP-N1, were co-transfected with internal control pRL-TK renilla luciferase vector into NT2 cells. Reporter luciferase activity was measured. Ratio of relative activity was calculated within group independent of each other. (J) Mature miR-214, miR-199a-3p and miR-199a-5p mRNAs expression after transfection of pEGFP-TP53 vector into NT2 cells. (K) The mRNAs expression of pri-miR-214, pri-miR-199a-1/2, TWIST1, REST and CREB after overexpression of TP53 in NT2 cells.

