Fig. 2.
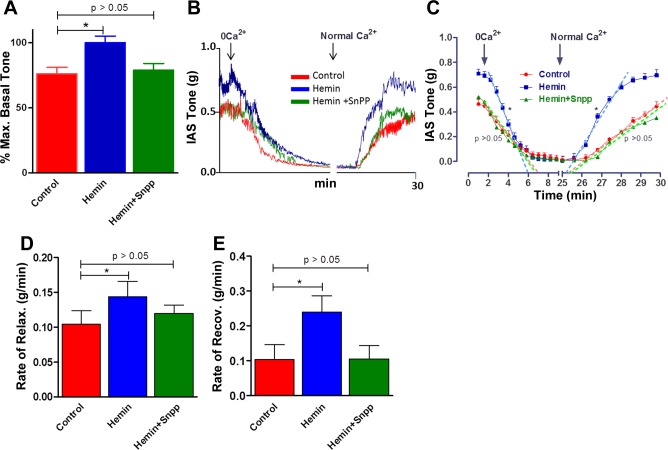
A: bar graphs show significant increase in the basal tone in hemin-pretreated rats compared with control animals. B: actual tracing showing decrease in the spontaneous basal tone at a faster rate in response to 0 Ca2+ in the IAS of hemin-pretreated vs. control rats. C: quantitative time course comparing the decreases in the IAS tone following 0 Ca2+ in control vs. hemin and hemin + SnPPIX. These data show significant increases in the IAS tone following hemin pretreatment (*P < 0.05; n = 4) that is blocked by pretreatment with SnPPIX. D and E: quantitative data showing significant increases in the rates of relaxation (with 0 Ca2+) and recovery (following normal Ca2+) (*P < 0.05; n = 4), respectively, in the hemin-pretreated group, which are blocked by the combination of hemin and SnPPIX. The regression lines (denoted by broken lines) were drawn by Prism Software.

