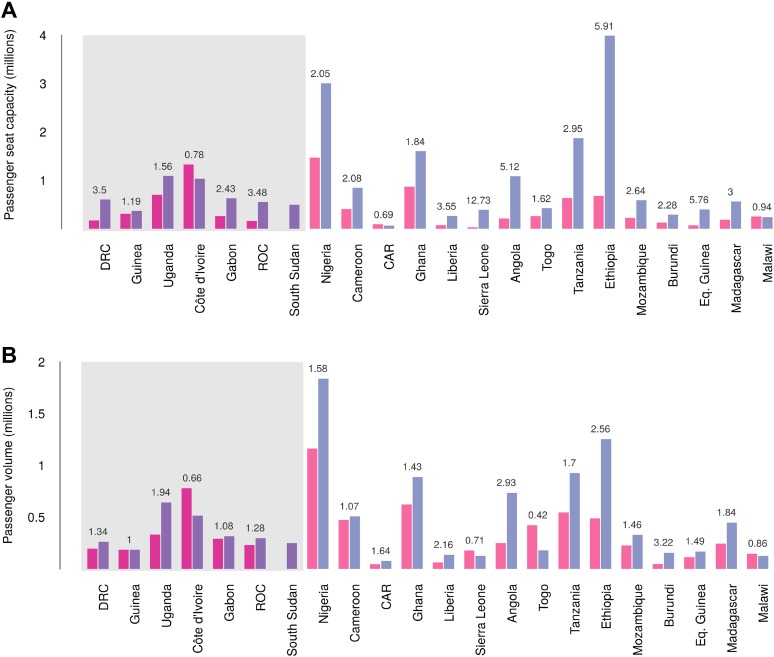
Figure 7. Changes in international flight capacity and traveller volumes for countries predicted to contain areas at-risk of zoonotic Ebola virus transmission.
The grey rectangle highlights countries in which index cases of EVD have been reported (Set 1). The remainder are countries in which risk of zoonotic transmission is predicted, but where index cases have not been reported (Set 2). (A) Shows changes in annual outbound international seat capacity (between 2000 in red and 2013 in blue). (B) Depicts changes in annual outbound international passenger volume by country (between 2005 in red and 2012 in blue). For each country, the fractional change in volume is given above each set of bars. Note that only one bar is presented for South Sudan as data for this region prior to formation of the country in 2011 were unavailable.

