
Fig. 2.
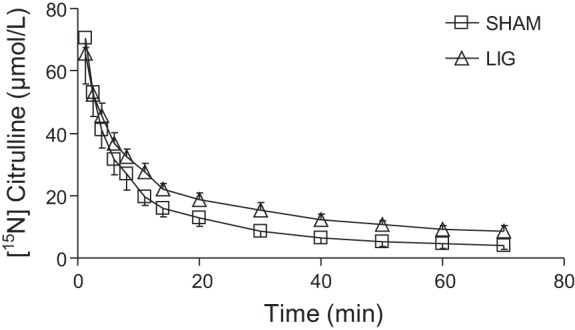
Plasma [ureido-15N]citrulline concentration after a bolus dose of this tracer in mice that underwent kidney ligation (LIG) or SHAM surgery. Biexponential curves were fitted to the data (LIGt = 49.6 ± 2.4·e(−0.27 ± 0.03·t) + 26.7 ± 2.2·e(−0.02 ± 0.00·t), R2 = 0.98; LIGt = 59.8 ± 1.1·e(−0.22 ± 0.01·t) + 16.3 ± 1.3·e(−0.03 ± 0.00·t), R2 = 0.94).