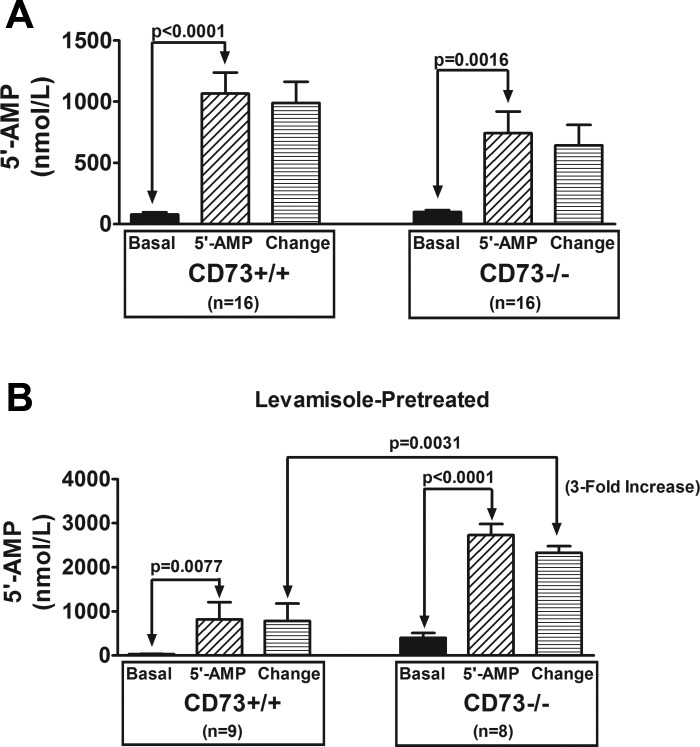
Fig. 1.
Bar graphs show the levels of 5′-AMP in the renal venous perfusate in CD73+/+ and CD73−/− kidneys under basal conditions and during infusions of 5′-AMP into the renal artery (final concentration of 5′-AMP in arterial perfusate of 10 μmol/l). Also shown is the change in renal venous perfusate levels of 5′-AMP induced by 5′-AMP administration (i.e., 5′-AMP minus basal). A: kidneys were not pretreated with levamisole. B: kidneys were levamisole-pretreated (1 mmol/l; final concentration in the arterial perfusate). All values represent means ± SE.

