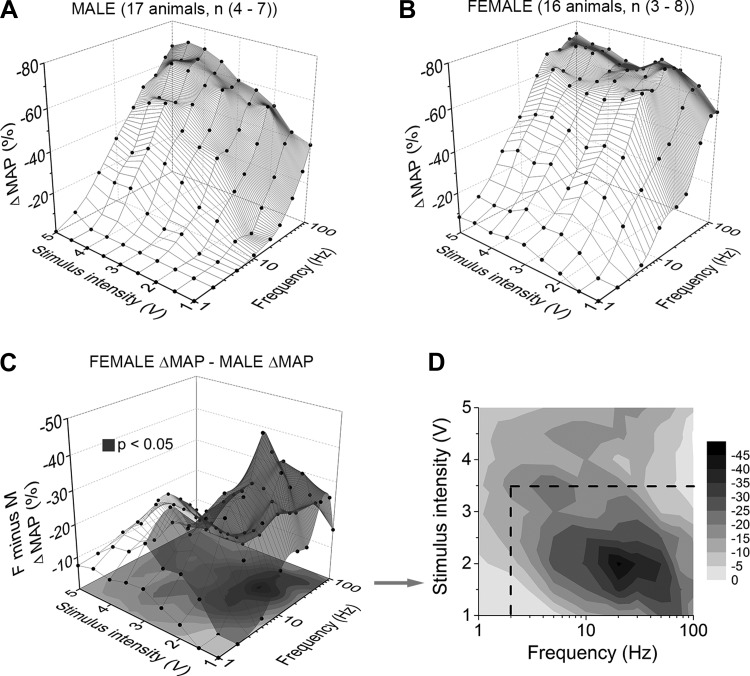
Fig. 7.
Peak depressor responses resulting from the selective stimulation of low-threshold, myelinated aortic baroreceptor fibers in male and female rats. Average change in left femoral mean arterial pressure from that just prior to stimulation of the left aortic depressor nerve (ΔMAP) of male (A, n = 17) and female (B, n = 16) rats. C: absolute difference in the average peak depressor response between male and female rats, i.e., female ΔMAP manifold minus the male ΔMAP manifold, or panel B minus panel A. The resulting shaded volume highlights the range of low-intensity (1–3.5 V) and low-frequency (peak at 20 Hz) stimulation pairs that evoke a significantly greater depressor responses in female rats than that from male rats. D: when presented as a 2-dimensional contour plot the darker areas indicate those pairs of voltage and frequency stimuli that evoke a significantly greater depressor response in females compared with male rats (P < 0.05, note the dashed enclosure).

