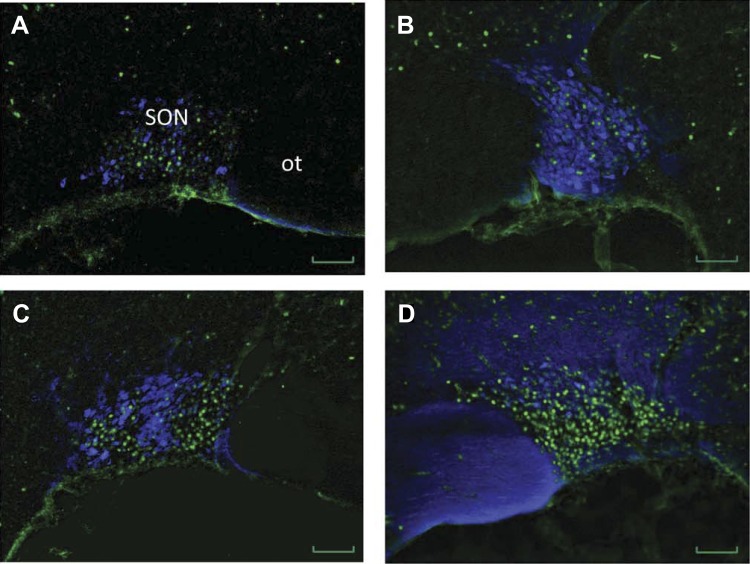
Fig. 5.
Representative digital images of oxytocin immunofluorescence (blue) merged with pseudocolored ΔFosB/FosB staining (green) of the supraoptic nucleus (SON) from a sham-ligated control (A and B) and a bile duct-ligated rat (C and D) injected with either a viral construct containing scrambled control shRNA (left) or a viral construct containing the AT1aR shRNA (right). ot, optic tract. Scale bar is 50 μm for each image.

