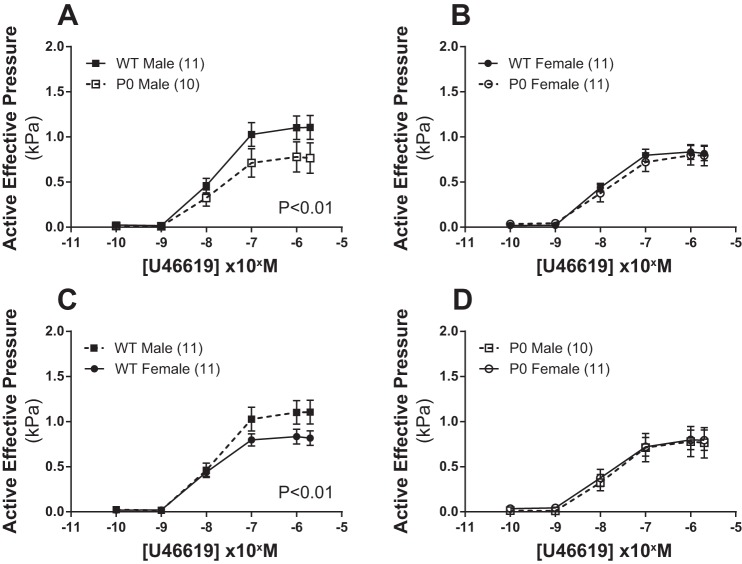
Fig. 1.
Contraction of fetal abdominal aortas in response to increasing doses of U46619. A–D: all data are expressed as means ± SE (n = number of animals). U46619 dose-response curves were compared using two-way ANOVA followed by a Bonferroni post hoc test where appropriate. ■ denotes WT male, while ● denotes WT female, □ denotes P0 male, and ○ denotes P0 females.

