Fig. 3.
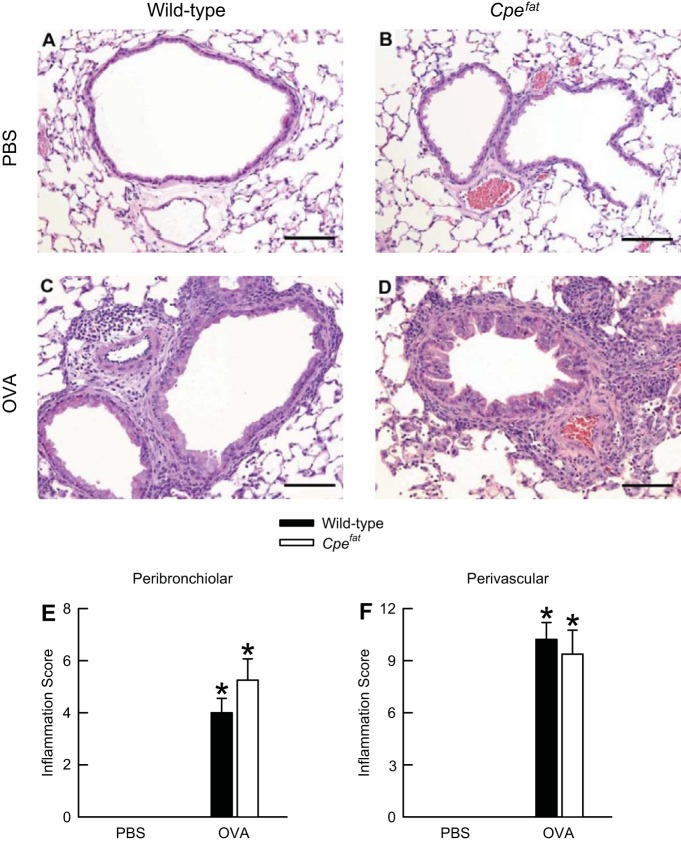
A−D: representative light micrographs of hematoxylin-and-eosin-stained histological sections as well as peribronchiolar (E) and perivascular (F) inflammation scores from the lungs of OVA-sensitized C57BL/6 and Cpefat mice challenged with aerosols of either PBS or PBS containing 4% OVA (wt/vol) once per day for seven consecutive days. A and B: lung sections from PBS-challenged wild-type and Cpefat mice, respectively. C and D: lung sections from OVA-challenged wild-type and Cpefat mice, respectively. The lungs were fixed in situ with 10% phosphate-buffered formalin 24 h following the cessation of the final aerosol challenge. In A−D, the images have been magnified with a 20× objective lens, while each of the scale bars in A−D represents 100 μm. E and F: each value is expressed as the mean ± SE. n = 8−9 mice for each group. *P < 0.05 compared with genotype-matched mice challenged with PBS.

