Fig. 3.
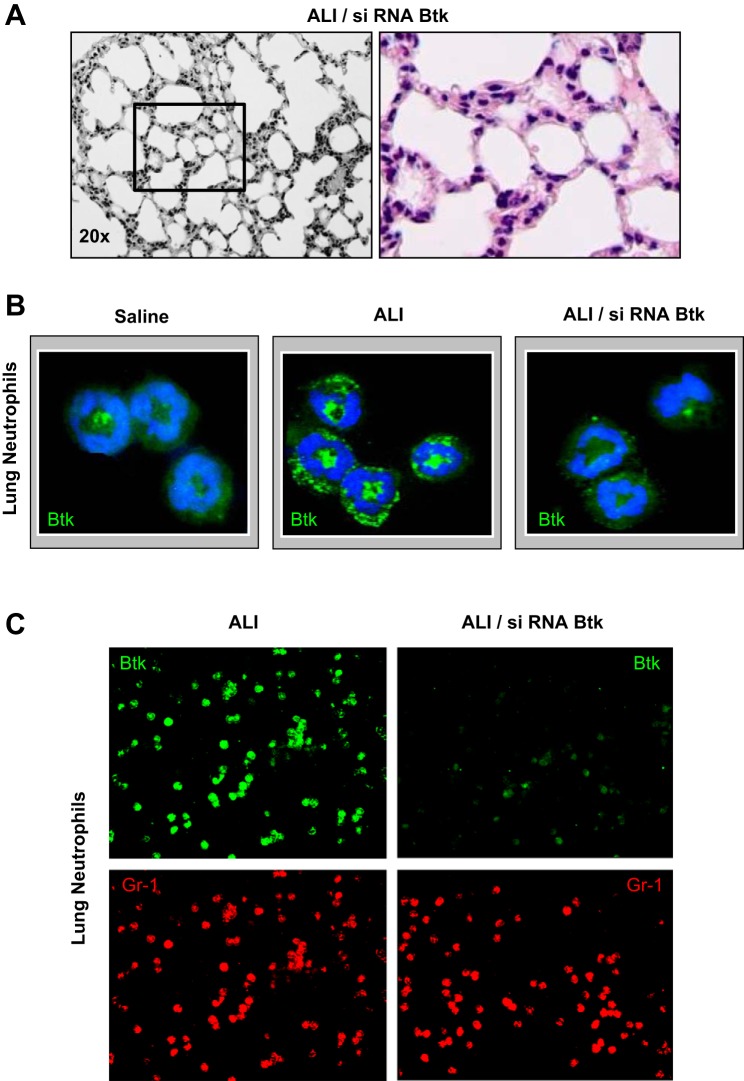
A: hematoxylin and eosin staining of lung sections of mice treated with LPS, siRNA for Btk, and anti-KC:KC ICs (ALI/siRNA Btk group). Experiments were performed using 3–6 mice for each treatment and typical findings from histological analysis of 3 mice per group are presented. B: expression of Btk (green) in lung neutrophils from mice treated with saline (Saline group), LPS and anti-KC:KC ICs (ALI group), and siRNA for Btk prior to the administration of ICs (ALI/siRNA Btk group). Hoechst 33442 was used to visualize DNA (blue). Alveolar neutrophils from 3 animals per group were analyzed and typical findings are presented. C: expression of Btk (green) in lung neutrophils (Gr-1; red) from mouse groups: ALI and ALI/siRNA Btk. Cells were photographed under the lower magnification (×20) and at least 300 neutrophils per group have been evaluated. Three animals per group were analyzed, and typical findings are presented. In A–C samples were collected 14 h after anti-KC:KC IC administration.

