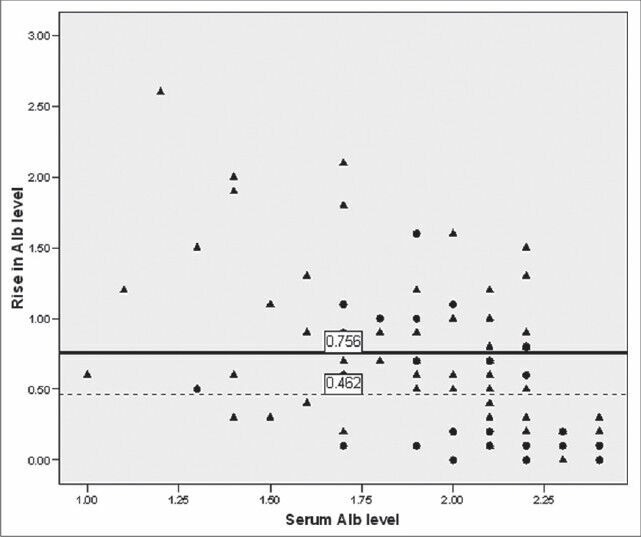
Figure 1.

Outcome of patients with respect to average rise in serum albumin level after albumin infusion and baseline albumin level. Solid circle (●) indicates death, triangle (▴) indicates survivors, solid line (-) shows mean increase in serum albumin level among survivors and dotted line (---) among patients who died
