Figure 4.

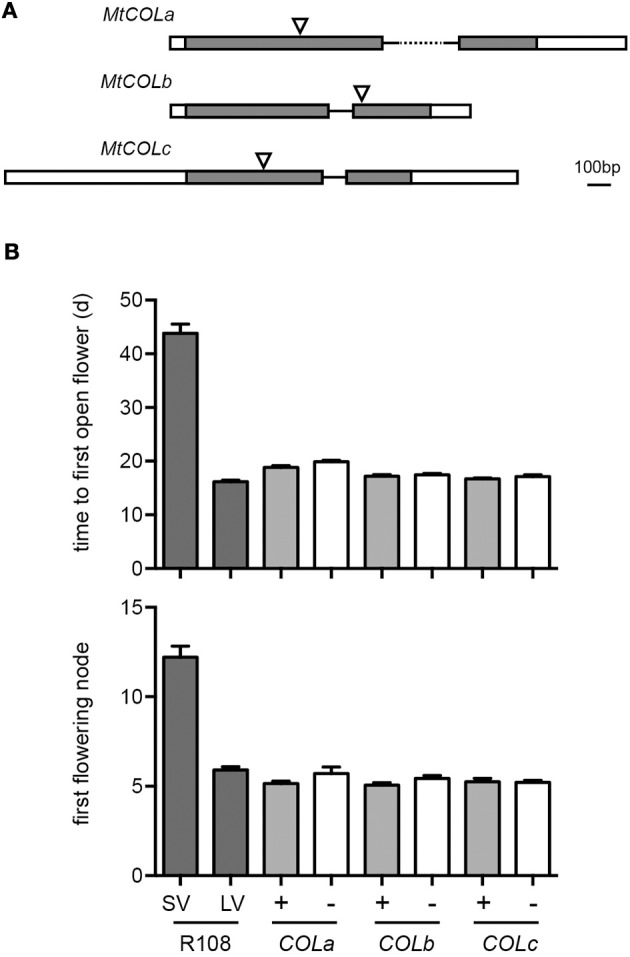
Characterisation of mutants for MtCOLa, COLb and COLc. (A) Diagram of MtCOLa, COLb and COLc genes showing gene structure and site of the Tnt1 insertion. Exons are shown as boxes with the coding sequence in dark gray, and the 5′ and 3′ untranslated regions in white. (B) Flowering time and node of first flower for WT and COL mutant plants vernalized for 14 days at 4°C before transfer to LD at 22°C. Homozygous WT (+) and mutant (−) genotypes were selected from segregating progenies and are represented by by shaded and empty bars, respectively. Vernalized R108 plants grown under LD (LV) or SD (SV) were included as a control. Values represent mean ± SE for n = 12–20.
