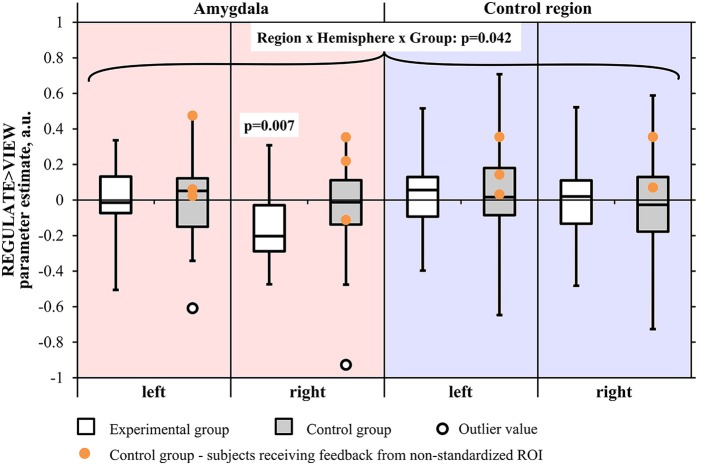
Figure 4.
Results of the region-of-interest analysis of the transfer run. Negative values indicate a decrease of the BOLD signal amplitude in the regulate condition (REGULATE) compared to natural responding toward aversive pictures (VIEW). White box plots: participants receiving feedback from the amygdala during training (experimental group). Gray box plots: participants receiving feedback from a standardized control region during training (control group). Orange dots: participants who had received feedback from a non-standardized control region during training due to a technical error (N = 3). P-values indicate probability of the findings for each group and mask under the null-hypothesis. Tests were not significant when correcting for multiple comparisons. Black circle: outlier value (3 standard deviations > group mean). A.u., artificial units.

