
Fig. 1 a.
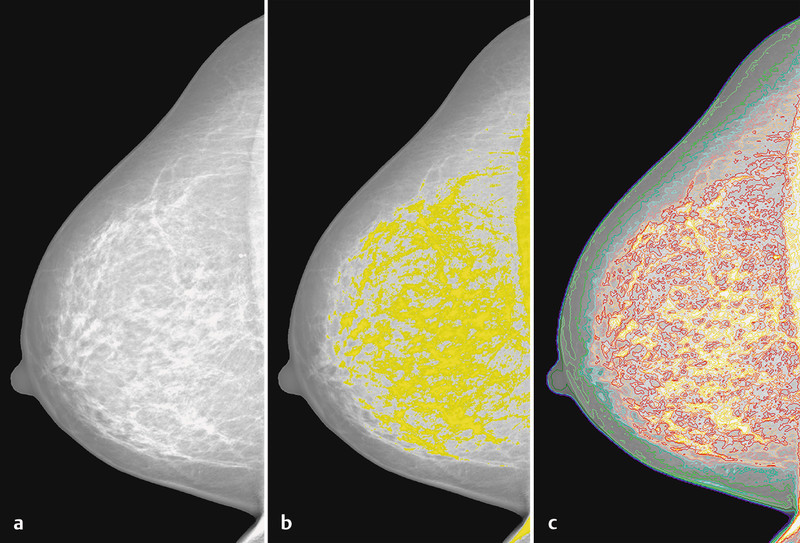
to c Computer-assisted assessment of mammographic density of a digitized mammogram (a) using the Madena computer program. The yellow marks represent a threshold, which is arbitrarily set by a user of the software (b), and the colored marks represent a priory defined gray level intervals (c) 46.