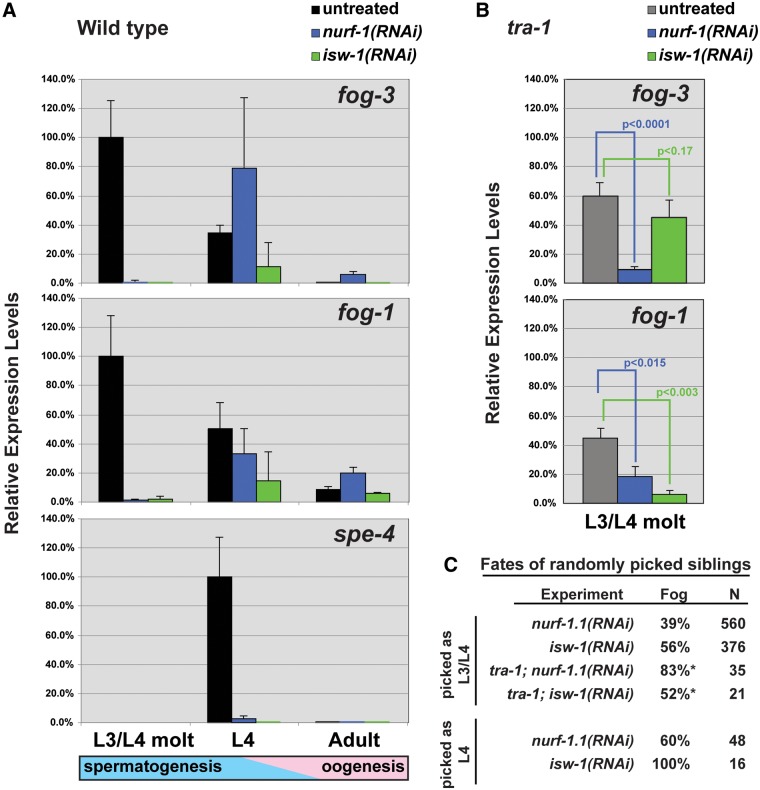
Fig. 3.
Caenorhabditis briggsae NURF-1A and ISW-1 control the expression of fog-1 and fog-3. Transcript levels were measured by real-time RT-PCR and calculated using 2exp(−ΔΔCT), with rpb-1 transcripts as a reference; fog-1 and fog-3 were normalized to wild-type animals at the XX L3/L4 molt and spe-4 to the XX L4. Error bars represent standard error of the mean. (A) Wild-type animals subjected to RNAi. (B) tra-1(nm2) animals subjected to RNAi. P values were determined with a Student’s t-test, one-tailed, with unequal variance. (C) The phenotypes of siblings of animals that were collected for transcript analysis.

