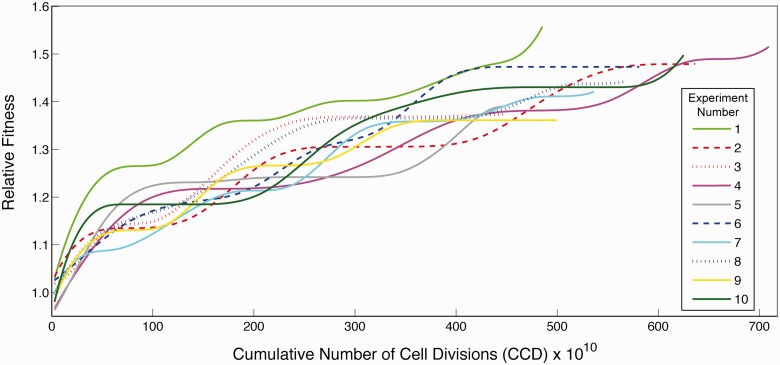
Fig. 1.
Fitness trajectories of the evolving populations. Plotted is the population increase in fitness relative to the initial average growth rate of the common starting strain. At the approximate CCD of 200 × 1010, the even-numbered experiments’ serial passage volumes were increased 10-fold to examine the impact of CCD on overall fitness. The variability in CCD across experiments is due to this as well as fluctuations encountered in passage cell density over the course of the ALE. Dashed and dotted lines represent populations that became dominated by hypermutators, with identical colors indicating a similar hypermutator genotype.

