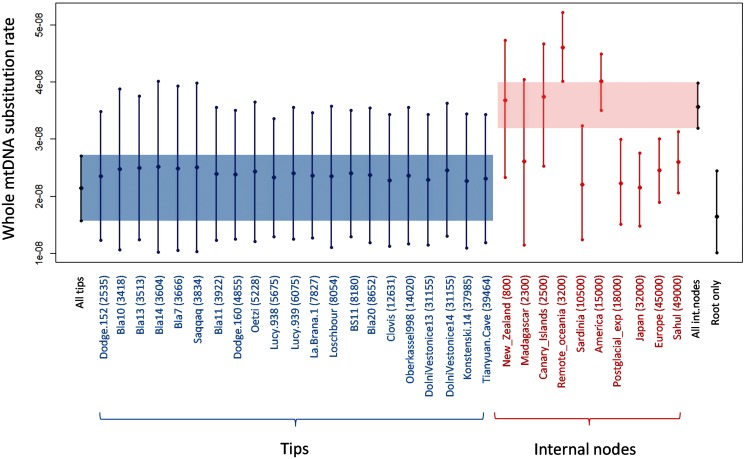
Fig. 3.
Variation in substitution rate among individual calibrations. Substitution rate estimates obtained using individual tip and node calibrations are reported for the whole mtDNA (in µ/site/year). Results are reported as 95% HPD intervals. Individual tips and nodes are sorted by their respective ages (given in years in brackets, see supplementary appendices S3 and S4, Supplementary Material online, for details). Global estimates obtained using all tips or all internal nodes simultaneously for calibration, as well as root-based estimate are also given for comparison.

