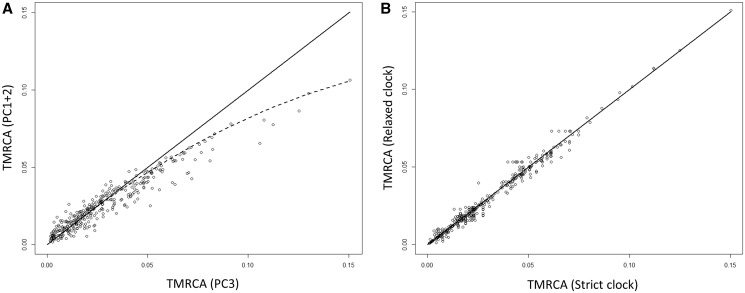
Fig. 4.
TMRCAs of AMHs obtained under different phylogenetic parameters. TMRCAs (in Ma) between all pairs of samples (belonging to the AMH clade only) obtained under different phylogenetic reconstruction parameters. The topology of the tree obtained using the full data (all sites in the mtDNA, see supplementary appendix S9, Supplementary Material online) has been fixed in BEAST. Panel (A) represents TMRCAs estimated the PC3 versus PC1+2 subsets of nucleotides. The solid line shows y = x line, and the dashed line is a polynomial regression of degree 2. Panel (B) represents the age of all nodes when independently estimated using either a strict or relaxed clock; the linear regression coefficient between the two sets of nodes is R2 = 0.98.

