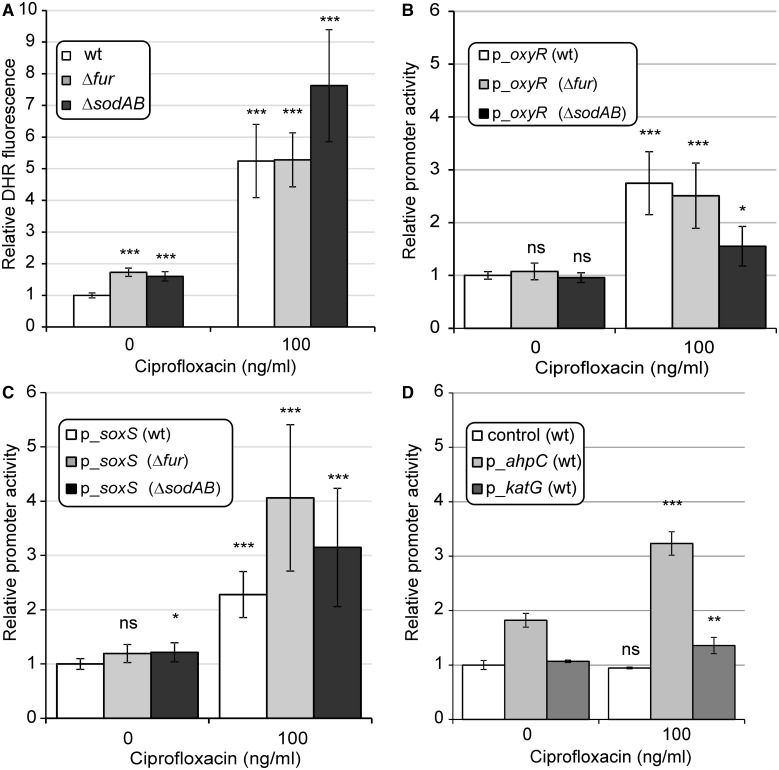
Fig. 4.
Direct measurement of oxidative stress induced by ciprofloxacin treatment. (A) Accumulation of ROS following exposure to 100 ng/ml ciprofloxacin in Δfur, ΔsodAB, and WT genotypes. DHR fluorescence was measured 24 h after addition of ciprofloxacin. Final fluorescence intensities were normalized to cell densities (OD600) and are shown relative to the untreated WT control. The mean of values is shown for n = 3. (B–D) Induction of promoters related to oxidative stress: oxyR, OxyR-regulated katG, ahpC, and soxS following exposure to 100 ng/ml ciprofloxacin. GFP intensities, indicating promoter activities, were measured 24 h after addition of ciprofloxacin. Relative promoter activities are shown; linear GFP signal intensities were normalized with GFP intensities of the untreated WT (B, C) or with GFP intensities of the untreated wild type bearing a promoterless construct (control in panel [D]). Error bars represent 95% confidence intervals. *P ≤ 0.05; **P ≤ 0.01; ***P ≤ 0.001; ns, P>0.05 (two-sample t-test). The mean of values is shown for n = 2. n represents the number of repeated, independent experiments. For more details, see Materials and Methods.

