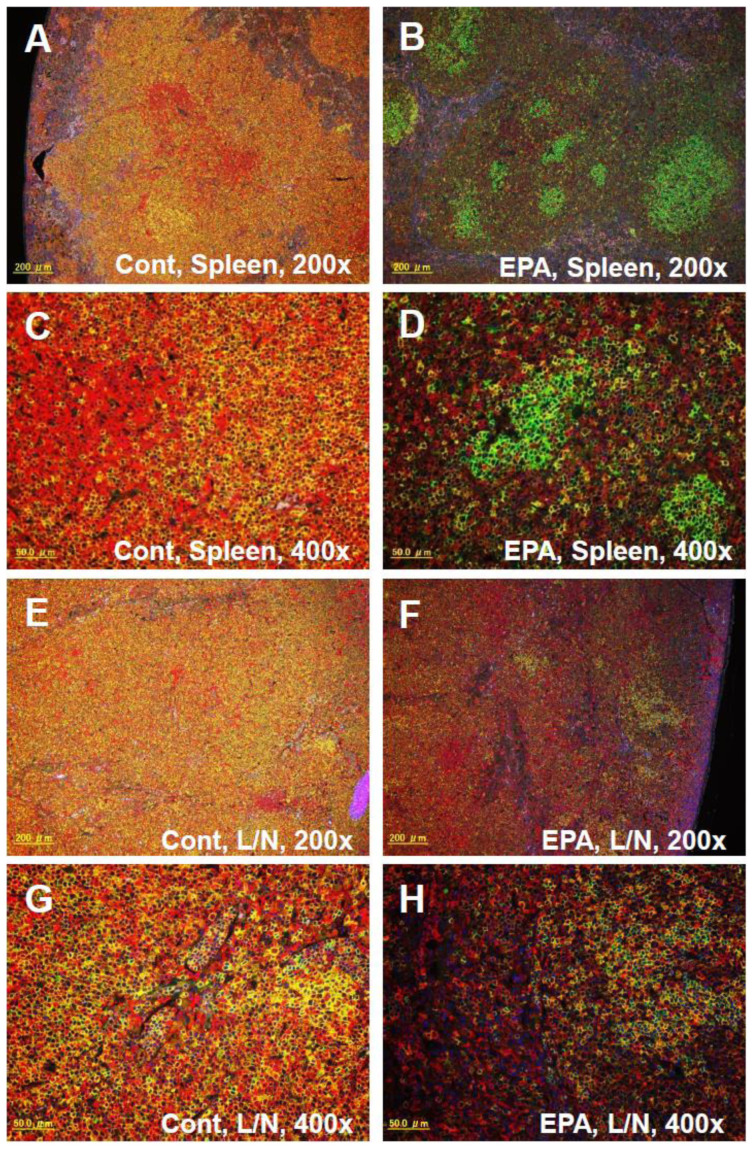
Figure 8. Immunohistochemical analysis of the spleen and lymph nodes.
Immunofluorescent staining with Alexa594 conjugated anti-CD3 (red) and Alexa488 conjugated anti-B220 antibodies (green) in the spleen (A, B, C, and D) and the lymph nodes (E, F, G, and H) of SCG/Kj mice fed a control diet (A, C, E, and G) or a 5% EPA-containing diet (B, D, F, and H) for 7 weeks. A, B, E, and F; Original magnification 200×. C, D, G, and H; Original magnification 400×.

