
Figure 5.
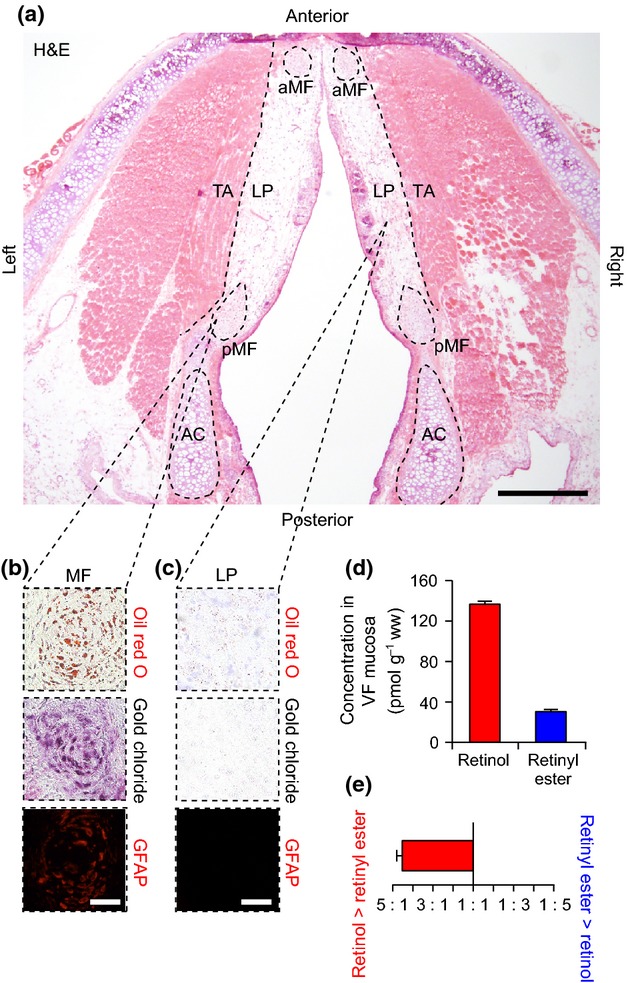
Analysis of histological features and vitamin A content in the rat vocal fold (VF). (a) Hematoxylin and eosin (H&E)-stained axial section showing the bilateral VFs. The dashed black lines show the boundary between the lamina propria (LP) and thyroarytenoid muscle (TA). The dashed black ellipses show the anterior and posterior macula flavae (aMF, pMF), and the arytenoid cartilages (AC). (b) Representative histological and immunostained sections showing oil red O+ (red), gold chloride+ (indigo/black) and glial fibrillary acidic protein (GFAP)+ (red) stellate cells within the MF. (c) Representative histological and immunostained sections showing oil red O−, gold chloride− and GFAP− cells within the LP. (d) Concentration of retinol and retinyl ester in rat VF mucosa. (e) Ratio of retinol to retinyl ester concentration in rat VF mucosa. Data in (d) and (e) are presented as mean ± SEM. Scale bar: 600 μm (a); 60 μm (b, c).