
Figure 5.
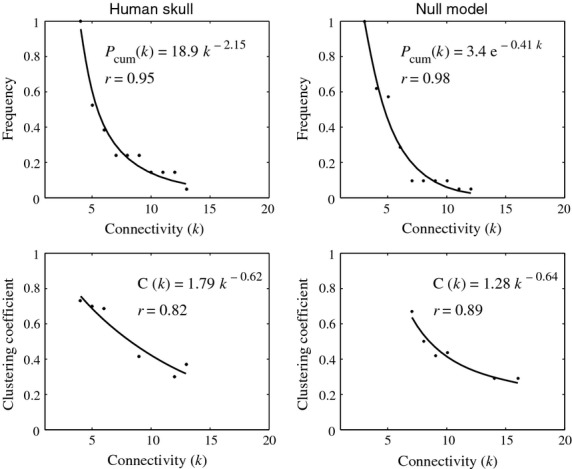
Connectivity distribution, P(k), and clustering coefficient distribution, C(k), of the human skull and the NNM. In the human skull network, P(k) and C(k) follow a power-law function, a type of right-skewed distribution in which a few bones have many connections and form many triangular motives, however many bones have few connections and participate in few triangular motives (Esteve-Altava et al. 2013a). In the NNM, the P(k) and C(k) also follow very similar right-skewed distributions, exponential and power law, respectively, which also indicate the presence of a hierarchical organization of bone connections.