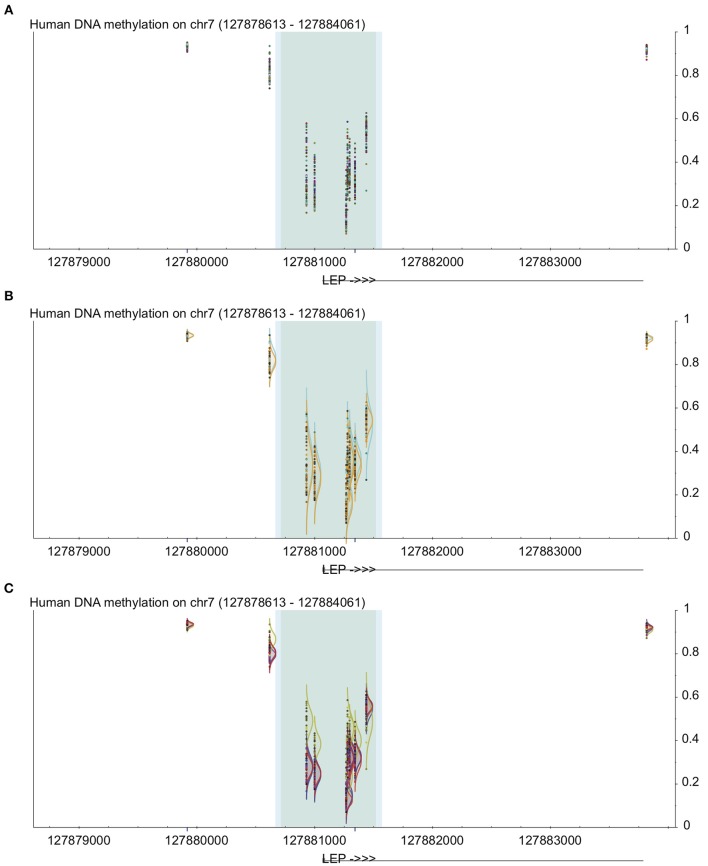
Figure 1.
Example of uses of visualization methods in DaVIE using LEP gene as an example. All panels show DNA methylation from 0 to 1 on the y-axis at the LEP promoter, including high-density CpG islands (dark gray) and intermediate density islands (light blue), with gene structure indicated below. Dark blue lines below indicate unreliable probes. (A) Points view shows overall level and general distribution of methylation. (B) Grouped by sex, no obvious differences are observed. (C) Grouped by tissue, one of the four different tissues in this project shows clear distinction.

