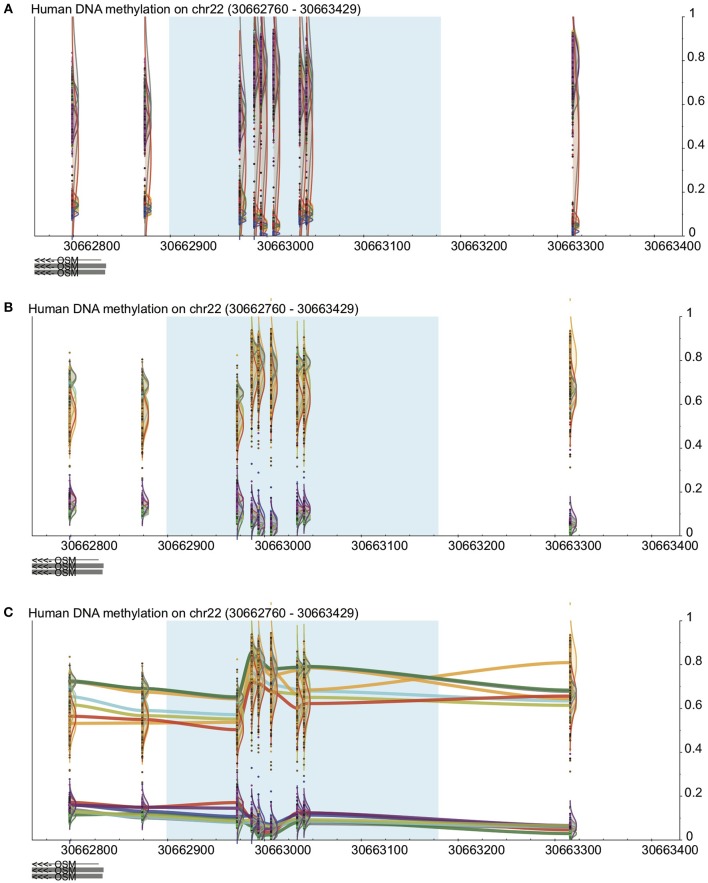
Figure 2.
Visualization in DaVIE across projects. See Figure 1 for key. (A) In a total of over 500 samples in 12 different tissues, distinct groups are observed but separation is not achieved when the samples are colored by project. (B) When colored by tissue type, separation between tissues is improved. (C) With the trace view, subtler differences between the tissues are made visible.

