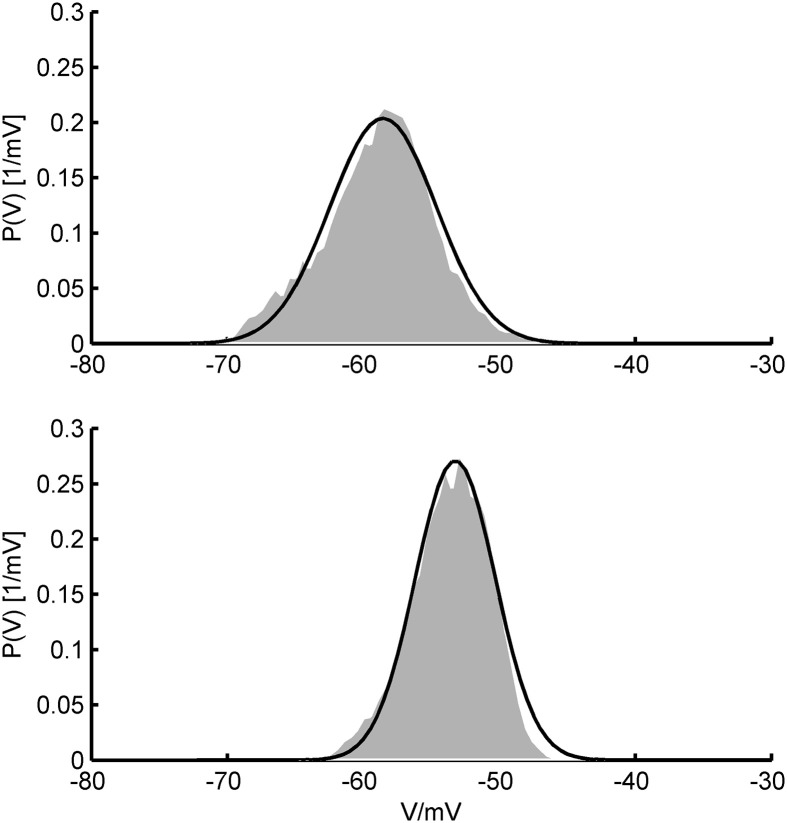
Figure 11.
In-vivo V-distributions and theoretical predictions. Two examples for the agreement of theoretically predicted membrane potential distributions (black curves) with ones obtained from in-vivo patch-clamp recordings (gray areas; data kindly provided by Dr. Thomas Hahn, Central Institute of Mental Health). In-vivo distributions were generated from voltage recordings during up-states in anesthetized rat prefrontal cortex. Theoretical fits were obtained by allowing the mean and standard deviation of the synaptic input to vary (and aligning distributions along the V-axis) while keeping single cell parameters fixed. Single cell parameters were drawn from the pool of AdEx model fits to in-vitro recordings (see text) and held constant in the process.

