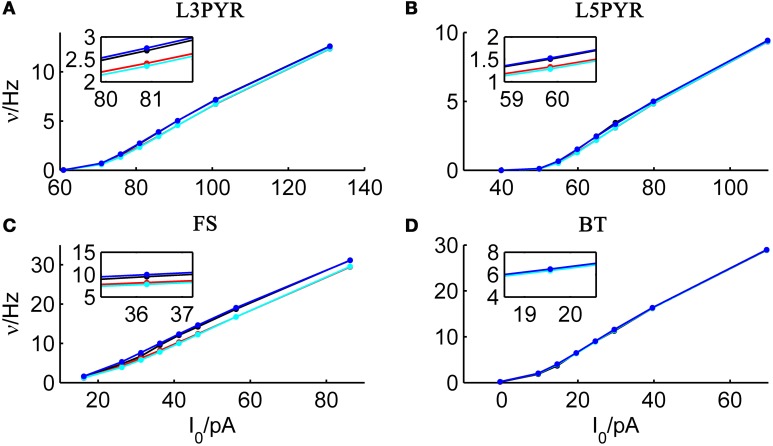
Figure 2.
Comparison of theoretical and simulated ν-I curves of the aEIF for different canonical cell types. The ν-I curves for a simulated (A) layer-3 pyramidal cell, (B) layer-5 pyramidal neuron, (C) fast-spiking and (D) bitufted interneuron (averaged model parameters given in Table 1) are shown in black and compared to the theoretical predictions (ν0: in cyan, ν0 + ϵ2 ν2: in blue, 〈 νEIF 〉w: red). μIsyn ∈ {r − 20, r − 10, r − 5, r, r + 5, r + 10, r + 20, r + 50} pA with r denoting the cell-specific rheobase, σIsyn = 150 pA. Insets show zoom-ins on the firing rate at the rheobase.

