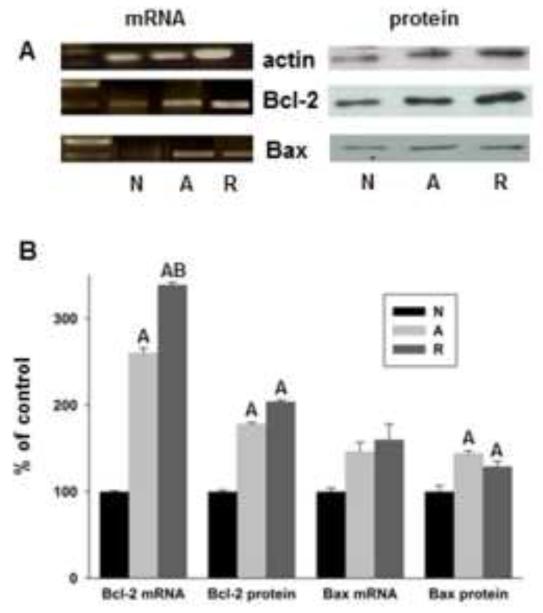
Figure 1.
Bcl-2 mRNA and protein levels increase significantly in anoxia and anoxia/reoxygenation compared to Bax. (A) Representative RT-PCR gels and western blots from Bcl-2, Bax, and actin; Bcl-2 and Bax are normalized to actin for all data. N = normoxia, A = 4h anoxia, R = 4h anoxia+ 4h reoxygenation. (B) Induction of Bcl-2 and Bax mRNA and protein levels as determined by Q-PCR and western blot, respectively. A = significantly different from respective normoxic control, B = significantly different from respective anoxic control (p<0.05), Bax mRNA levels did not change significantly between conditions. Data are normalized to actin signal. N= 5/treatment.

