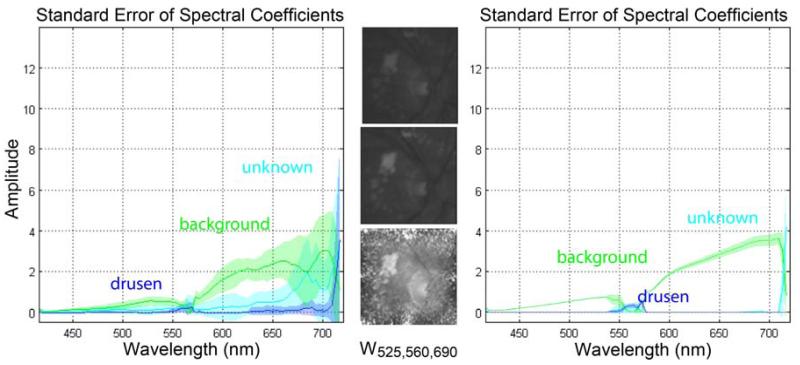
Fig 4.
Intra-subject variability for different localized ROIs sampled from patient C. (LEFT) Spectral NMF coefficients for ROIs=c1-c20. Component 3 shows a response between the 550 and 600nm interval and high variability in the upper part of the wavelength spectrum. (CENTER) Slices at wavelength 525, 560, 690 nm. (RIGHT) Spectral NMF coefficients for ROIs=c2,c4,c8, c11,c20. After ROI stratification component 3 only shows a response peak around the 550nm region.

