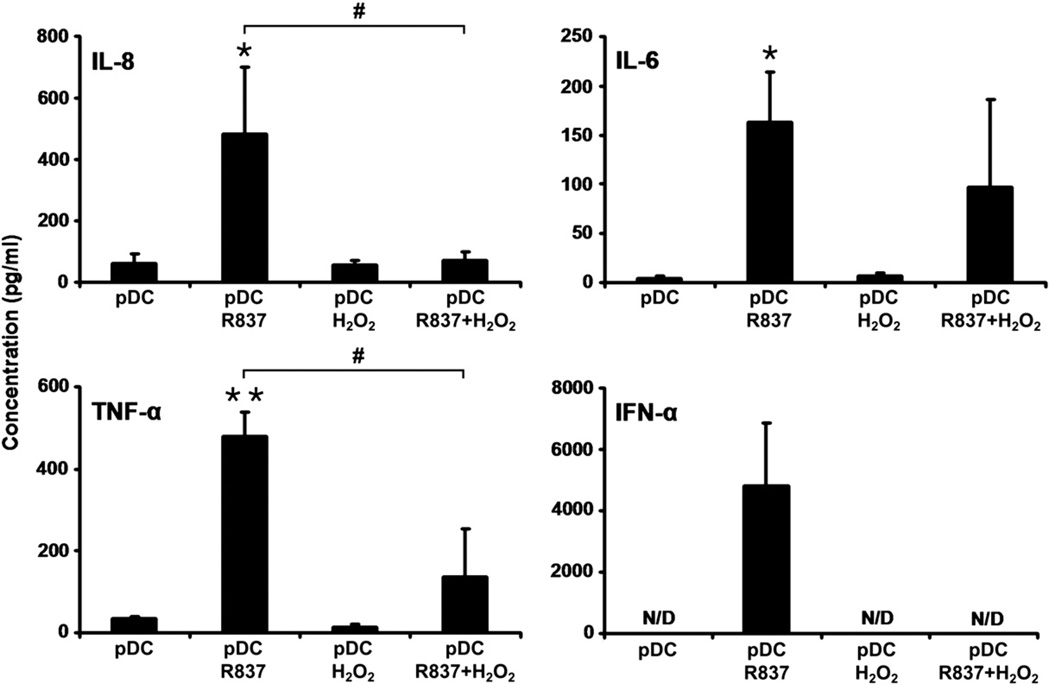
Fig. 3.
Chemokine and cytokine production of H2O2-treated pDCs. H2O2 (0.01 µM) alone, R837 alone, or both together were added to cultured primary pDCs and the levels of IL-8, IL-6, TNF-α, and IFN-α were measured by means of ELISA in culture supernatants at 24 h after treatment Data are presented as means ±SE of three individual experiments. *P<0.05, **P<0.01 vs untreated control cells, #P<0.05 vs cells treated with R837 only. N/D, not detectable.

