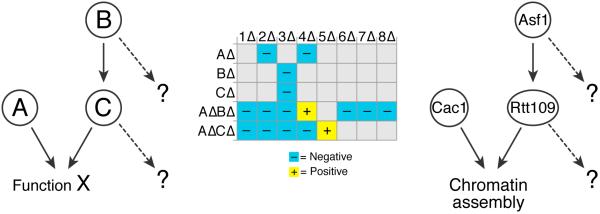
Figure 4. TMA can reveal differences between collaborative components.

In this illustrative schematic, proteins B and C work together, and in parallel with protein A, to carry out function X. Standard E-MAPs exhibit similar genetic profiles for BΔ and CΔ, but higher order analysis via TMA reveals significant differences in a AΔ background. Thus, although B and C share an important common function, they have different secondary functions that were unmasked by TMA. We have used this methodology to uncover differences between Asf1 and Rtt109. Asf1 is necessary for the Rtt109-dependent acetylation of histone H3-K56 and their E-MAP profiles are highly similar. However, TMA in a cac1Δ background revealed significant differences between asf1Δ cac1Δ and rtt109Δ cac1Δ in their interactions with HIRA and SWR-C complex member deletions.
