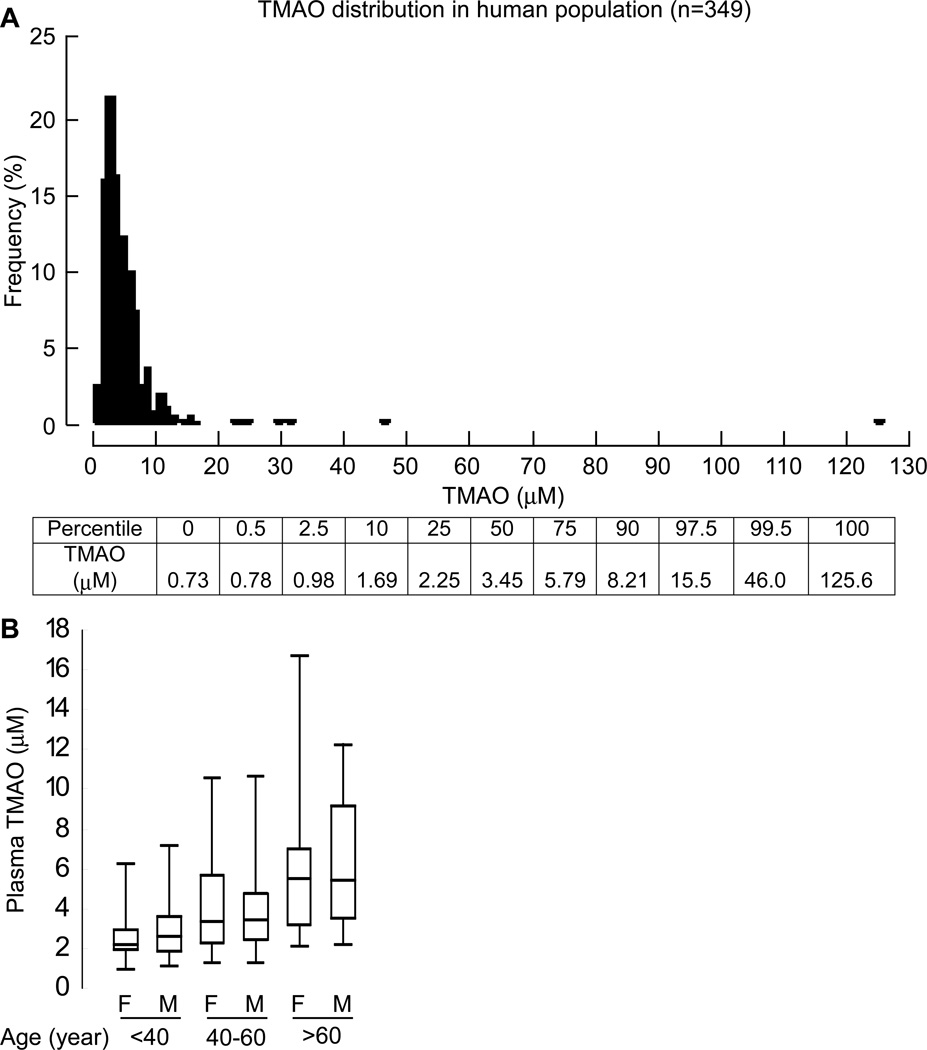
Fig. 6.
(A) Distribution of TMAO concentrations in healthy volunteers (n=349). Lower bar gives the concentrations of TMAO at each percentile. (B) Box whisker plot showing distribution of the TMAO concentration with respect to age and gender in the above population (n=349). The population was segregated by age and gender as shown on lower axis. Horizontal in middle of box = TMAO concentration at median value, top of box at 75th percentile, bottom of box at 25th percentile, top of whisker at 97.5 percentile and bottom of whisker at 2.5 percentile in the specified population.

