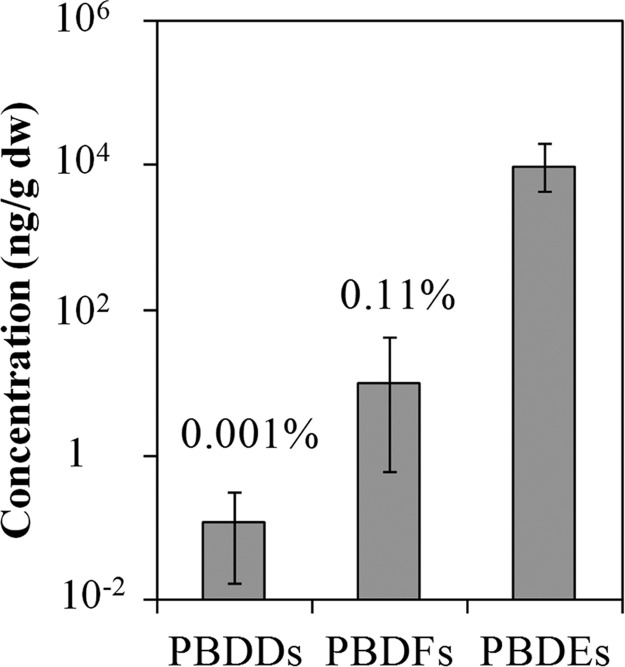
Figure 1.
Concentration of PBDDs and PBDFs relative to the total PBDE levels detected in biosolids composites (n = 5) prepared from 113 samples collected by the U.S. EPA during its 2001 national sewage sludge survey from 94 facilities in 32 U.S. states and the District of Columbia. Percentages above the bar represent the respective levels relative to the total PBDE levels in the biosolids. Whiskers represent minima and maxima.

