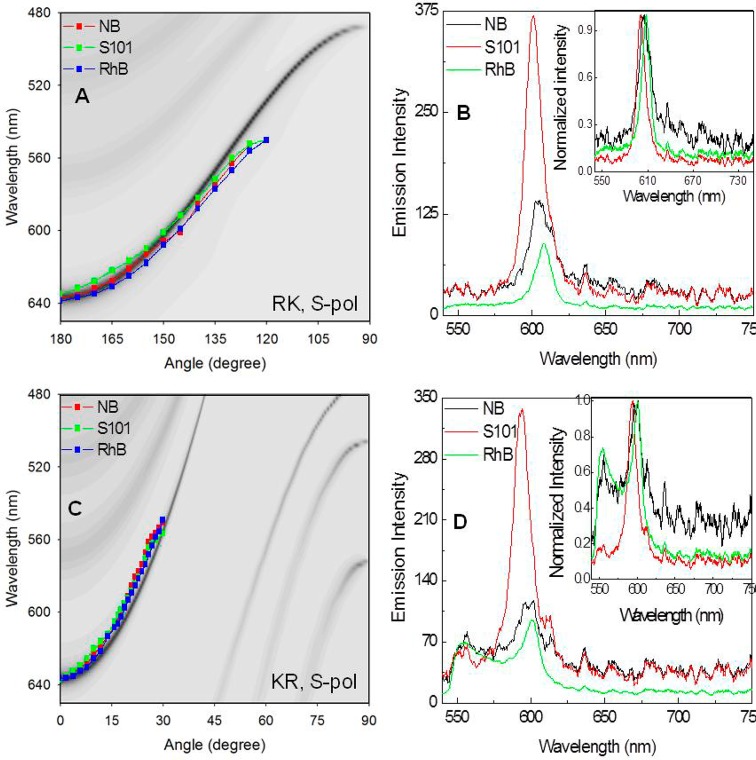
Figure 13.
Calculated S-polarized light dispersion diagrams for RK (A) and KR (C) and observed angle-dependent shift in S-polarized emission maxima of Nile Blue (NB), S101, and RhB from the Tamm structure. Panels B and D show the emission spectra of three dyes observed at angle of 150° for RK and 18° for KR S-polarized emission. The inset figures in panels B and D are the corresponding intensity normalized spectra from all three probes. The dye location is below the metal layer.

