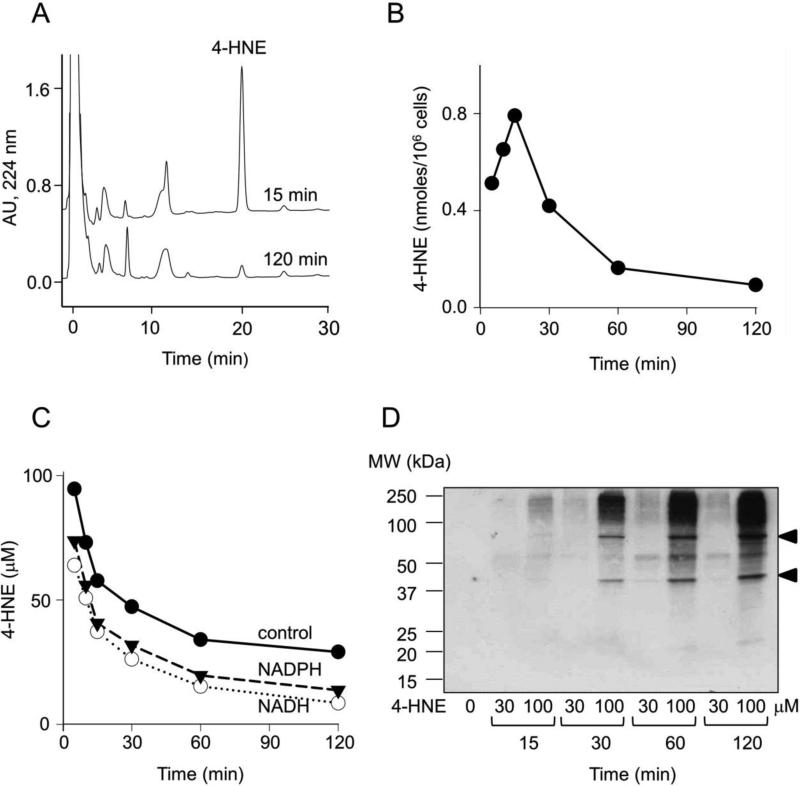
Figure 1. Metabolism of 4-HNE in PAM 212 keratinocytes.
Cells were treated with 30 or 100 μM 4-HNE for increasing periods of time up to 120 min. For analysis of 4-HNE, cells were washed and 4-HNE extracted as described in the Materials and Methods. Panel A. Representative HPLC tracing of 4-HNE extracted from cells 15 min and 120 min post treatment with 100 μM 4-HNE. Panel B. Time course of 4-HNE accumulation and degradation in cells treated with 100 μM 4-HNE. Panel C. Time-course of 4-HNE metabolism in S9 fractions of mouse keratinocytes. S9 fractions of PAM 212 cells were incubated with 100 μM 4-HNE in the absence and presence of 1 mM NADH or NADPH. At the indicated times, 4-HNE was extracted and quantified by HPLC. Panel D. Time-dependent formation of 4-HNE-protein adducts in intact cells treated with control, 30, or 100 μM 4-HNE. For this analysis, treated cells were lysed and analyzed by Western blotting using a monoclonal antibody to 4-HNE. Arrowheads show the appearance of modified proteins with molecular weights of 43 and 75 kDa.

