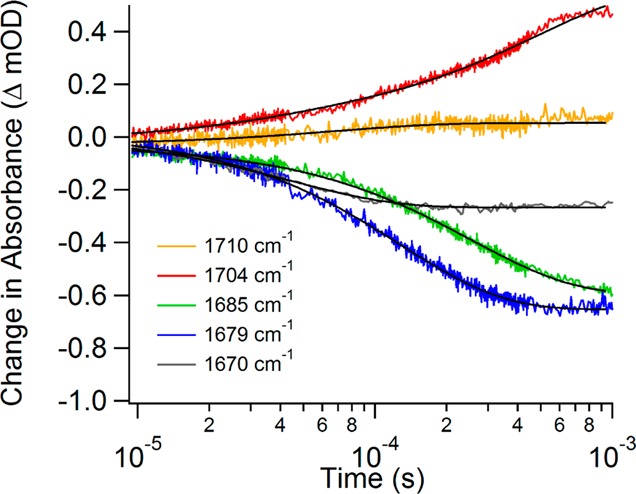
Figure 3.

Isotope-labeled IR difference temperature-jump relaxation transients of [U-15N, -13C]LDH•NADH•[2-12C]pyruvate minus [U-15N, -13C]LDH•NADH•[2-13C]pyruvate at various probe frequencies. Each probe frequency is plotted as a different color as specified in the legend, and the exponential fits are plotted as black lines.
