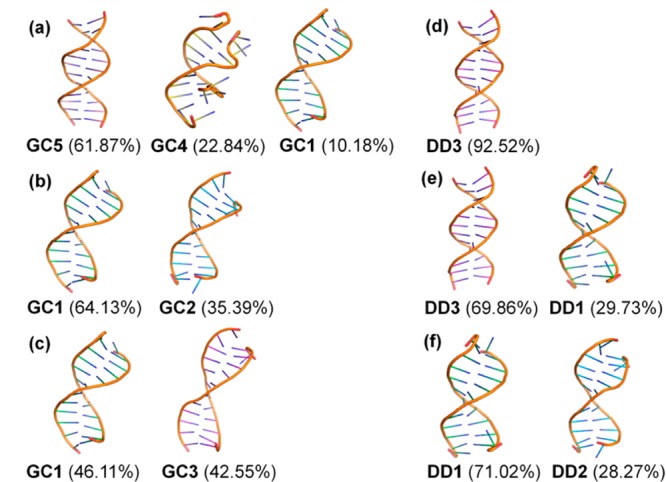
Figure 3.

Representative conformations from clustering analysis in different dielectric environment for GC-rich dodecamer with ε = 80 (a), 40 (b), and 20 (c) and for the Drew-Dickerson dodecamer with ε = 80 (d), 40 (e), and 20 (f). Cluster populations are given in the parentheses.
