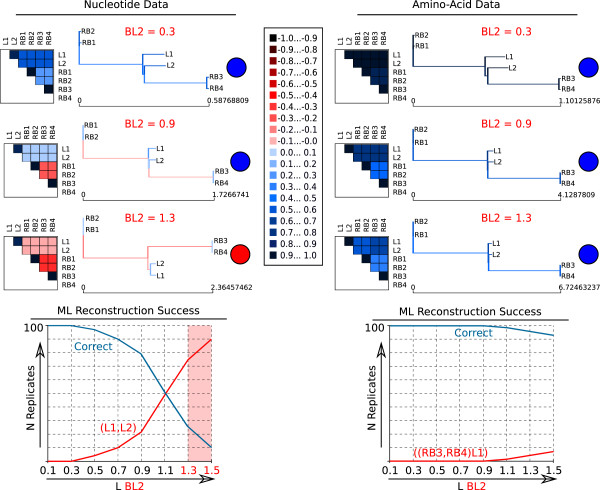
Figure 3.

AliGROOVE example results of 6-taxon simulation tests (simulation setup B). Simulation setup B (Figure 1b) using six taxa (sequence length: 50,000 bp). The overall ML reconstruction success corresponds to pairwise similarity scores obtained between L1,L2 and remaining taxa (RB1-RB4) and decreases with a more frequent incorrect grouping of (L1,L2) with increasing lengths of BL2 (from dark blue to red). Colour coded similarity score ranges are shown in the center. Lacking reliability of internal branches connecting L1 and L2 scores negatively (red internal branch) in cases where the corresponding ML topologies are incorrect (red circles). All results of 6-taxon simulations are given as Additional file 3.
