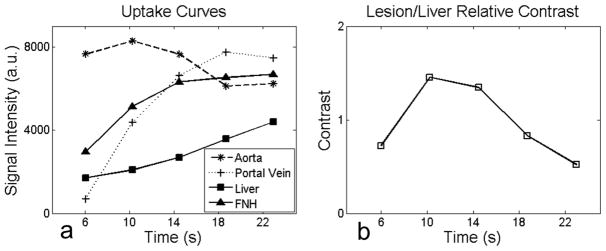
FIG 4.

High temporal resolution imaging enables the capture of rapid contrast changes between the lesions, liver parenchyma and blood vessels. A time-frame with maximum lesion/liver contrast is identifiable. a) A characteristic signal intensity curve shows the change of intensity due to uptake of the GBCA in the liver from ROIs placed on the aorta, portal vein, liver parenchyma and the FNH in a subject. b) Relative lesion/liver contrast curve across multiple time-frames from the same subject. The second time-frame in this example has the maximum lesion/liver relative contrast. This temporal information is not available in clinical MRI since only one image is typically acquired within a breath-hold. The horizontal axis shows the time each frame was completed relative to the start of data acquisition.
