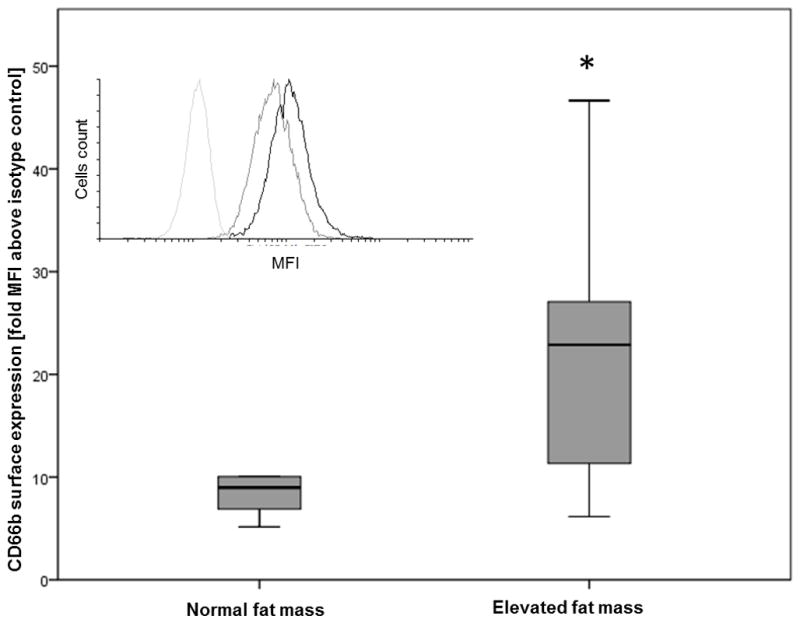
Figure 2. Basal neutrophil degranulation‡ according to fat mass category† in a subsample of male participants (n=23)¥.

Main figure:
‡ Surface expression of CD66b in granulocytes (CD16b+ cells) by flow cytometry performed in fresh whole blood samples (ratio of CD66b-FITC median fluorescence intensity (MFI) and isotype control MFI)
† Normal fat mass <20%, elevated fat mass ≥ 20%
¥ Boxes represents median (black line) and 25th and 75th percentile and error bars represents range for CD66b surface expression.
* Mann Whitney: p=0.015.
Inset figure: Representative histogram of fluorescence intensity in FL1 for granulocytes. Isotype control (light gray line), CD66b-FITC from a low fat mass donor (dark gray line), CD66b-FITC from an increased fat mass donor (black line).
