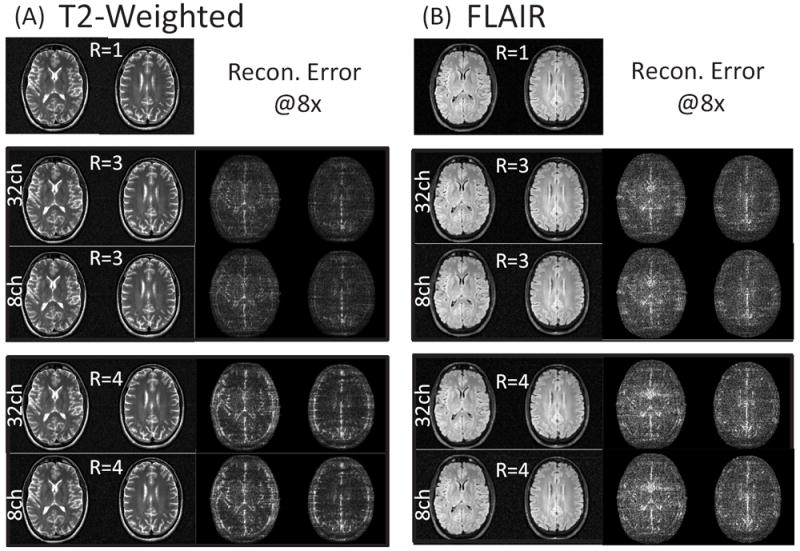
Figure 3.

CS+SENSE reconstructed images and error for T2 and FLAIR imaging contrasts. The dynamic range for the error images is scaled to 1/8 of the fully sampled and sensitivity combined ground truth images. (A) shows the R = 1 sensitivity combined images for the T2 contrast at a resolution of 0.8 × 0.8 × 3mm3. The reconstructed images and error are shown below for R = 3 and 4 accelerations using either the coil compressed 8-channel under-sampled data or the full 32-channel data. Similar results are shown for the FLAIR images at a resolution of 1.0 × 1.0 × 3mm3 in (B).
