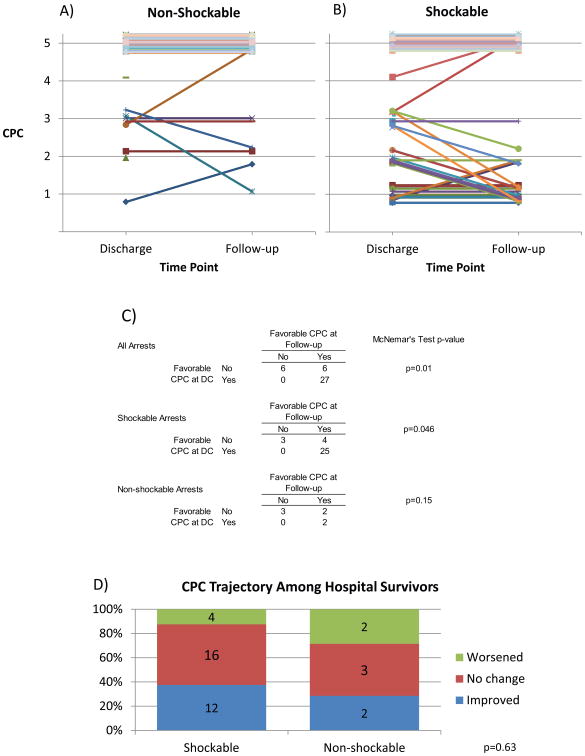
Figure 3.
Comparison of Neurological Outcomes for nSR and SR Arrests and Discharge and Follow-up: (a and b) Each line represents an individual patient. Data appear staggered around CPC integers to assist visualization, though all CPCs are integer values. Plots include all patients, according to rhythm. Individuals with only a single data point available are represented by a point. C) Comparison of dichotomized outcomes at discharge versus follow-up. D) Depiction of whether individuals who were discharged alive worsened, remained stable, or improved in CPC between hospital discharge and follow-up. Numbers inside each category on the graph indicate n-values. P-value is for chi-squared test.

